
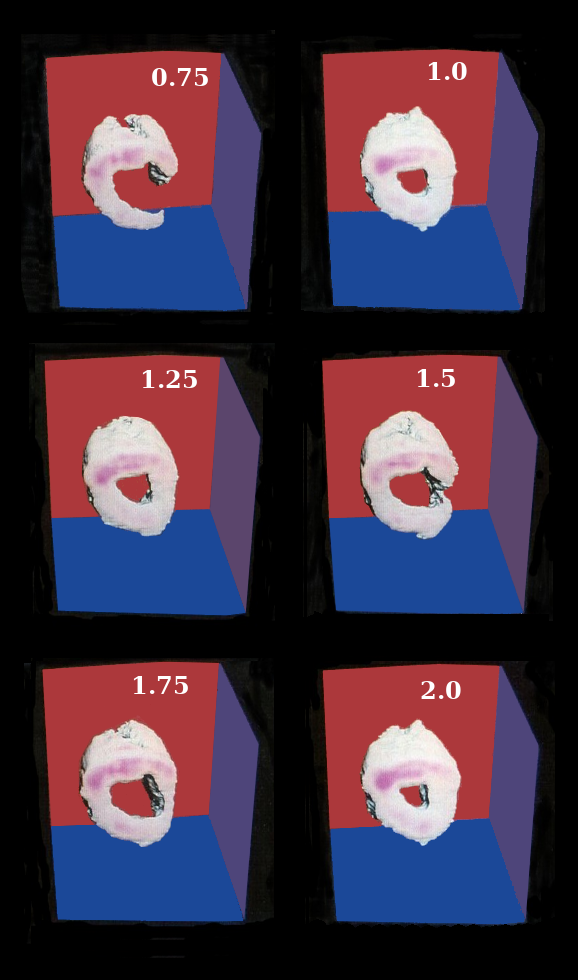
Myocardial perfusion throughout a complete cardiac cycle. Phase-points 1.0 and 2.0 correspond to systole. Observe the slow filling of the cardiac chamber following systole compared to the rapid volume ejection just prior to systole at phase-points 1.0 and 2.0. Compare to raw projection images of contrast dye perfusion, reconstructed with High-Efficiency CT from 3 bi-plane projections.
In collaboration with James R. Spears, MD, Wayne State University, MI.